Debugging a Spark Job with 🔥DataFlint
How an open-source Spark UI replacement helped us find data skew, partition bloat, and shuffle spill.
We had a six-month backfill job that was crawling — about 1.2 hours per run, processing 826 GiB of input with nearly half the cores sitting idle. We knew it could run faster, but Spark’s native UI was not telling us much — just a wall of stages and tasks.
Then we tried DataFlint.
Two Lines of Config
DataFlint (GitHub) is an open-source drop-in replacement for the Spark UI:
spark.jars.packages=io.dataflint:spark_2.12:0.8.6spark.plugins=io.dataflint.spark.SparkDataflintPluginThat is it. No data export, no external services. It adds a tab to the existing Spark UI with actual useful information.
What the Shuffle Metrics Told Us
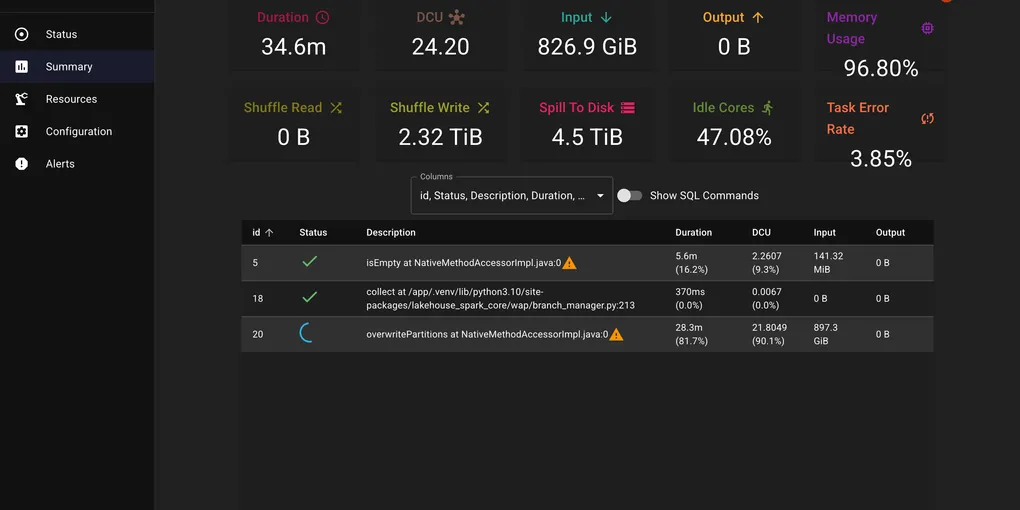
The screenshot above was captured mid-execution, but even partway through, the dashboard told the story: 2.32 TiB of shuffle writes, 4.5 TiB spilling to disk, 47% idle cores, memory at 96.8%, and a 3.85% task error rate. We use the S3 shuffle plugin, where shuffle data streams through local disk before being uploaded to S3. The 4.5 TiB disk spill meant data was written to disk faster than it could drain to S3 — a clear sign of too many concurrent shuffle writes overwhelming the upload pipeline.
The native Spark UI would have eventually surfaced this if we had clicked through enough stages and tasks. DataFlint presented it upfront — we found the high disk spill and skew straight from its performance alerts. That gave us a clear trail to follow.
Too Many Small Partitions
The shuffle volume pointed us to the first problem: the job was creating far more tasks than necessary. Hundreds of small input files meant hundreds of map tasks, each processing tiny amounts of data and each generating its own shuffle output. More tasks means more shuffle writes, more S3 upload requests, and more scheduler overhead. The 47% idle cores confirmed it — tasks were finishing unevenly and executors were waiting around.
We increased spark.sql.files.maxPartitionBytes to pack more data per partition:
spark.conf.set("spark.sql.files.maxPartitionBytes", "1g") # default is 128mFewer, larger tasks means better bin packing of shuffle blocks across fewer files. Each task now does more useful work instead of spending time on setup and teardown.
Data Skew
With the partition count under control, DataFlint’s skew alert pointed to the second problem: one partition held 10x more data than the others. A few tasks were doing all the work while the rest sat idle — explaining both the 47% idle cores and the 96.8% memory usage on the hot executors.
We added a salting key to distribute the hot partition across multiple buckets:
from pyspark.sql import functions as F
# Salt the skewed keydf = df.withColumn("salt", (F.rand() * 10).cast("int"))df = df.withColumn("salted_key", F.concat(F.col("join_key"), F.lit("_"), F.col("salt")))
# Join on salted key, then drop salt columns
Shuffle Spill Resolved
The 4.5 TiB disk spill that DataFlint had originally flagged resolved itself once the partition count and skew were fixed. With data evenly distributed across fewer, right-sized tasks, no single executor ran out of memory and the S3 upload pipeline kept up with the shuffle writes.
Result
We applied the same fixes — maxPartitionBytes and salting — to our daily ETL job that shared the same data patterns. It went from 15 minutes to 3 minutes.
The backfill completed in a fraction of the time we had originally budgeted. And the daily job now runs 5x faster, every day. Over a year, that adds up to meaningful compute cost savings — and less time waiting for data to be ready.
If you are debugging Spark jobs and find the native UI hard to parse, give DataFlint a try. It is Apache 2.0 licensed and takes 5 minutes to set up.